Strategy and risk

Value at risk by strategy: how to read the numbers

24 April 2026 · By Evgenii Voronchikhin

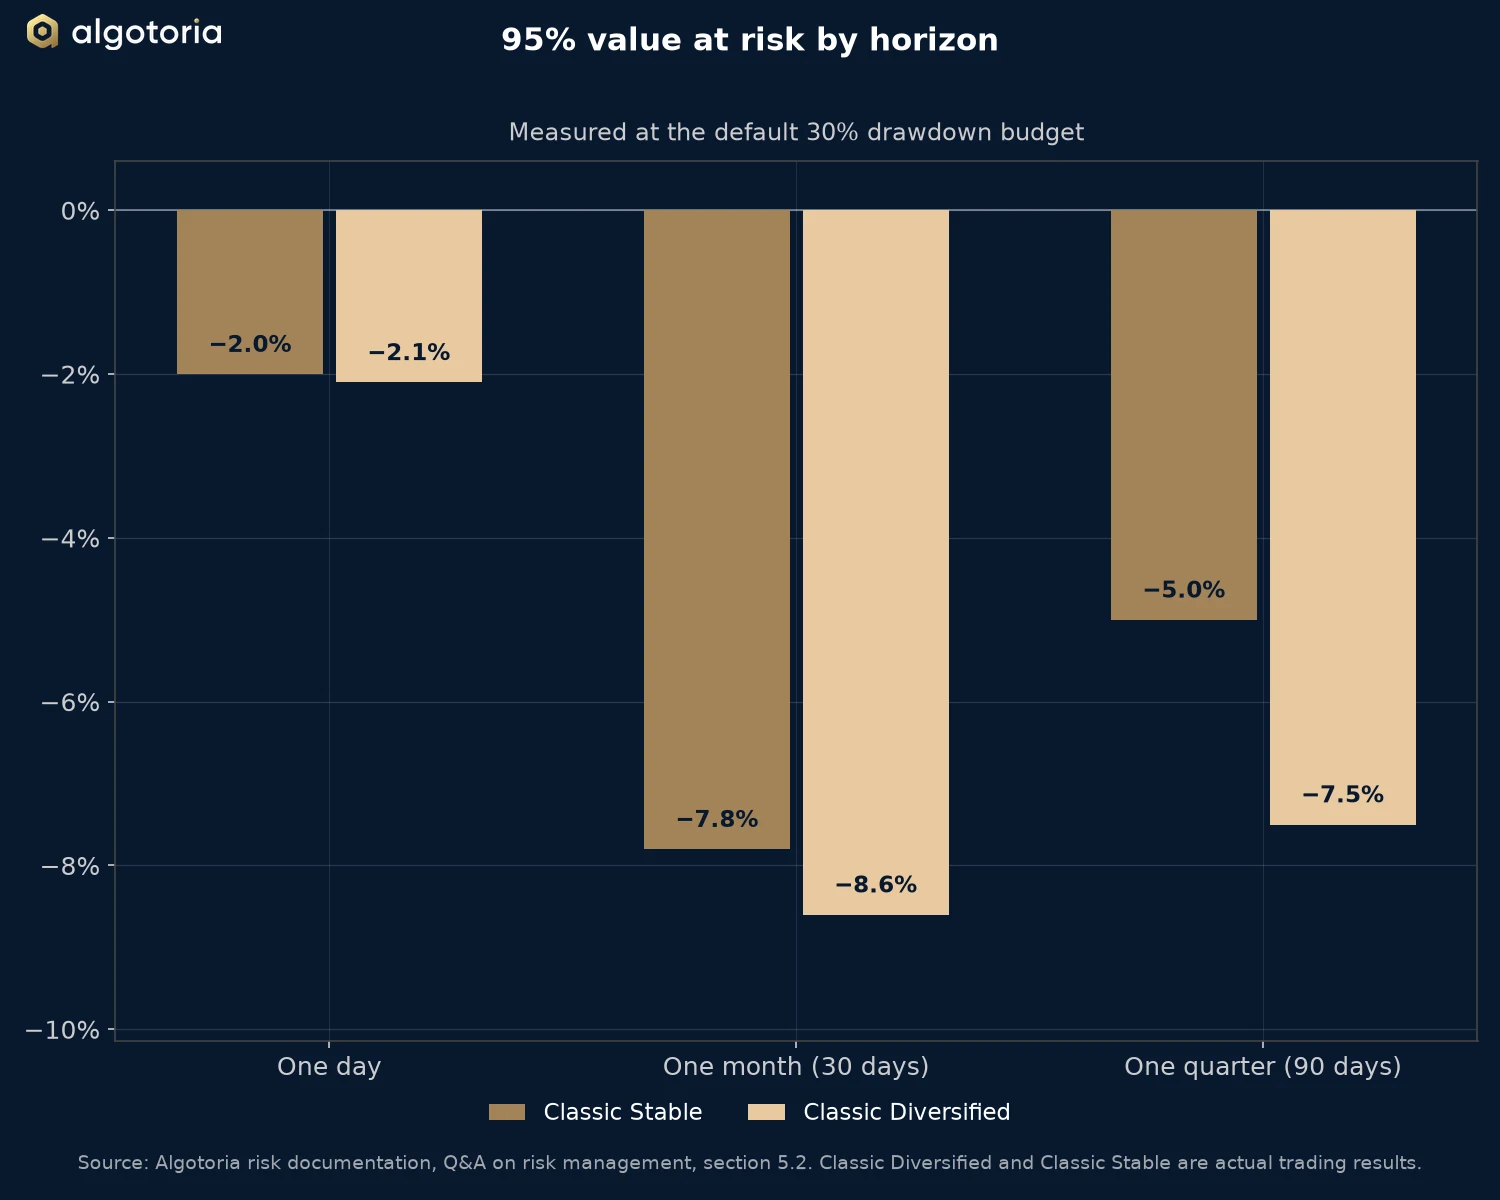
Bar chart of 95% value at risk over one day, one month and one quarter for Classic Stable and Classic Diversified.
95% value at risk by horizon at the default 30% drawdown budget. Source: Algotoria risk documentation.

Algotoria measures risk with statistics rather than by judgement. One of the measures is value at risk, or VaR. This article sets out the 95% VaR estimates for Classic Stable and Classic Diversified, explains how to read them, and states what the measure does not show.

What 95% VaR measures

The 95% VaR of a period is a loss level that is not expected to be exceeded in 95% of cases. Put plainly, it describes how bad an ordinary period of stress can be, as distinct from an extreme event.

The other side of the same statement matters as much. In about one period in twenty, the loss is expected to be larger than the VaR figure, and the figure itself does not say by how much.

What the current estimates show

Algotoria estimates 95% VaR for Classic Stable and Classic Diversified over three horizons: one day, one month (30 days) and one quarter (90 days). The estimates are statistical measures at the default drawdown budget. They are not limits on loss.

95% value at risk by horizon
HorizonClassic StableClassic Diversified
One day−2.0%−2.1%
One month (30 days)−7.8%−8.6%
One quarter (90 days)−5.0%−7.5%
Measured 95% value at risk at the default 30% drawdown budget. Source: Algotoria risk documentation (Q&A on risk management, section 5.2).

Classic Diversified carries a slightly higher short-term risk than Classic Stable. Part of the reason is the additional volatility of Bitcoin in its collateral. At the portfolio level, the firm monitors 95% one-day VaR with a target of approximately 2%, as the frequently asked questions describe.

How to read the horizons

A longer period gives losses more time to build, so the one-month figure is larger than the one-day figure for both strategies. The quarterly figure, however, is smaller than the monthly one for both. Over the measured history, three-month windows ended with a smaller loss at the 95% level than one-month windows did.

Algotoria’s risk documentation reads this as evidence that mean-reversion and compounding dynamics begin to dominate once the horizon passes one month, so that drawdowns tend to smooth out over two to three months. This is a description of the historical pattern. It is not a statement about the next quarter.

What VaR does not show

VaR is a useful measure and an incomplete one. It does not show how severe the losses are in the worst 5% of cases, because it marks the boundary of that tail and says nothing about what lies inside it.

It does not capture rare, extreme events, which by definition are absent from most historical samples. It also depends on the period used for the estimate, so the same strategy gives a different figure over a calm year and over a turbulent one.

The history shows the point. In December 2025, Classic Stable returned −14.88% and Classic Diversified −15.64%, gross of fees. Both months were worse than the monthly VaR estimate, which is what a 95% measure allows in roughly one month in twenty.

Why VaR is one metric among several

For these reasons Algotoria does not rely on VaR alone. It sits beside the drawdown budget, the review stages that follow it and the position and leverage controls described in the frequently asked questions.

An investor should read the VaR figures as the scale of an ordinary bad period, and the Risk Disclosure Notice as the description of what can happen beyond it.

Get Started

Typical onboarding takes one business day, plus the international bank transfer if you fund from fiat.

Start a conversation

Tell us a little about yourself and a co-founder will reply within one business day.

By submitting, you agree we may contact you at the details above. We do not share your data with third parties. For qualified investors only. We keep enquiry details for 12 months if they do not lead to a relationship. See our Privacy Notice at algotoria.com/privacy.

How is portfolio risk measured? What VaR target do you run?

The firm monitors 95% one-day parametric VaR at the portfolio level, computed on exchange-matched returns, with a target of approximately 2%. No single sub-strategy may contribute more than 5% of the portfolio's 95% VaR. Realised correlations between sub-strategies are monitored daily; if they drift above Investment Committee thresholds, affected sub-strategies are de-weighted or temporarily suspended. Drawdown thresholds are monitored at the strategy, sub-strategy and instrument level. A breach raises a real-time alert and escalates to the IC; the de-risking itself is then executed by the trading team under the Chief Trader's direction. The only continuously automatic risk reduction is volatility-scaled position sizing and the stop-losses attached to every trade.

What drawdowns should I realistically expect?

Typical annual drawdowns of 20–25% on Algotoria Classic Stable, 15–30% on Algotoria Classic Diversified. Historical back-tests reached 30%. Drawdowns beyond these ranges trigger a formal Investment Committee review.

All drawdown figures quoted on this site — and the agreed drawdown budget selected during onboarding — are measured on the gross trading-account return curve, before deduction of Algotoria's quarterly performance fee. Net-of-fee drawdowns experienced by the investor are larger by construction. Worked example: for Algotoria Classic Stable over 2024-01-01 → 2026-09-30, the adjusted maximum drawdown is −24.7% gross, −30.2% net of a 25% fee, and −31.3% net of a 30% fee.

What is the "drawdown budget" (formerly "account risk"), and how is it enforced?

The drawdown budget is the target maximum gross drawdown of the account from its most recent high-water mark — the headline number selected during onboarding (10% / 20% / 30% for Classic Stable; 15% / 25% / 35% for Classic Diversified). No drawdown-triggered de-risking is implemented in the trading software and none is applied by default. Drawdown is alerted in real time at 60%, 80% and 100% of the budget; at two-thirds of the budget the Investment Committee reviews the account and decides case by case whether to reduce risk, and at the full budget you are notified and choose whether to continue, reduce the budget or stop trading. The automatic layer is volatility-scaled position sizing and the stop-losses attached to every trade — nothing else de-risks an account on its own. An automated hard stop at a level you specify can be agreed as a custom policy for your account at onboarding. It is an engineered envelope, not a guarantee — the Risk Disclosure Notice publishes the estimated probability of exceeding it. The investor may change the tier at any quarter-end.

What is the maximum leverage, and how is it controlled?

Aggregate leverage is capped at 3.0× of account value across all open positions, and is dynamic — it scales down as realised volatility rises. By risk tier, average applied leverage is roughly 100% at High, 67% at Medium, 33% at Conservative; maximum applied leverage is 300 / 200 / 100%. Lower tiers are delivered by scaling leverage down; the strategy logic, signal generation and execution model are otherwise identical across tiers.

See the full due-diligence FAQ for 50+ additional questions.
Algotoria Limited is a BVI-regulated Approved Investment Manager under the Securities and Investment Business Act, 2010. The content on this page is informational and does not constitute an offer to sell securities or investment advice. Services are available to qualified investors only. Past performance is not indicative of future results.