Performance reports

Monthly report: April 2026

2 May 2026 · By Evgenii Voronchikhin

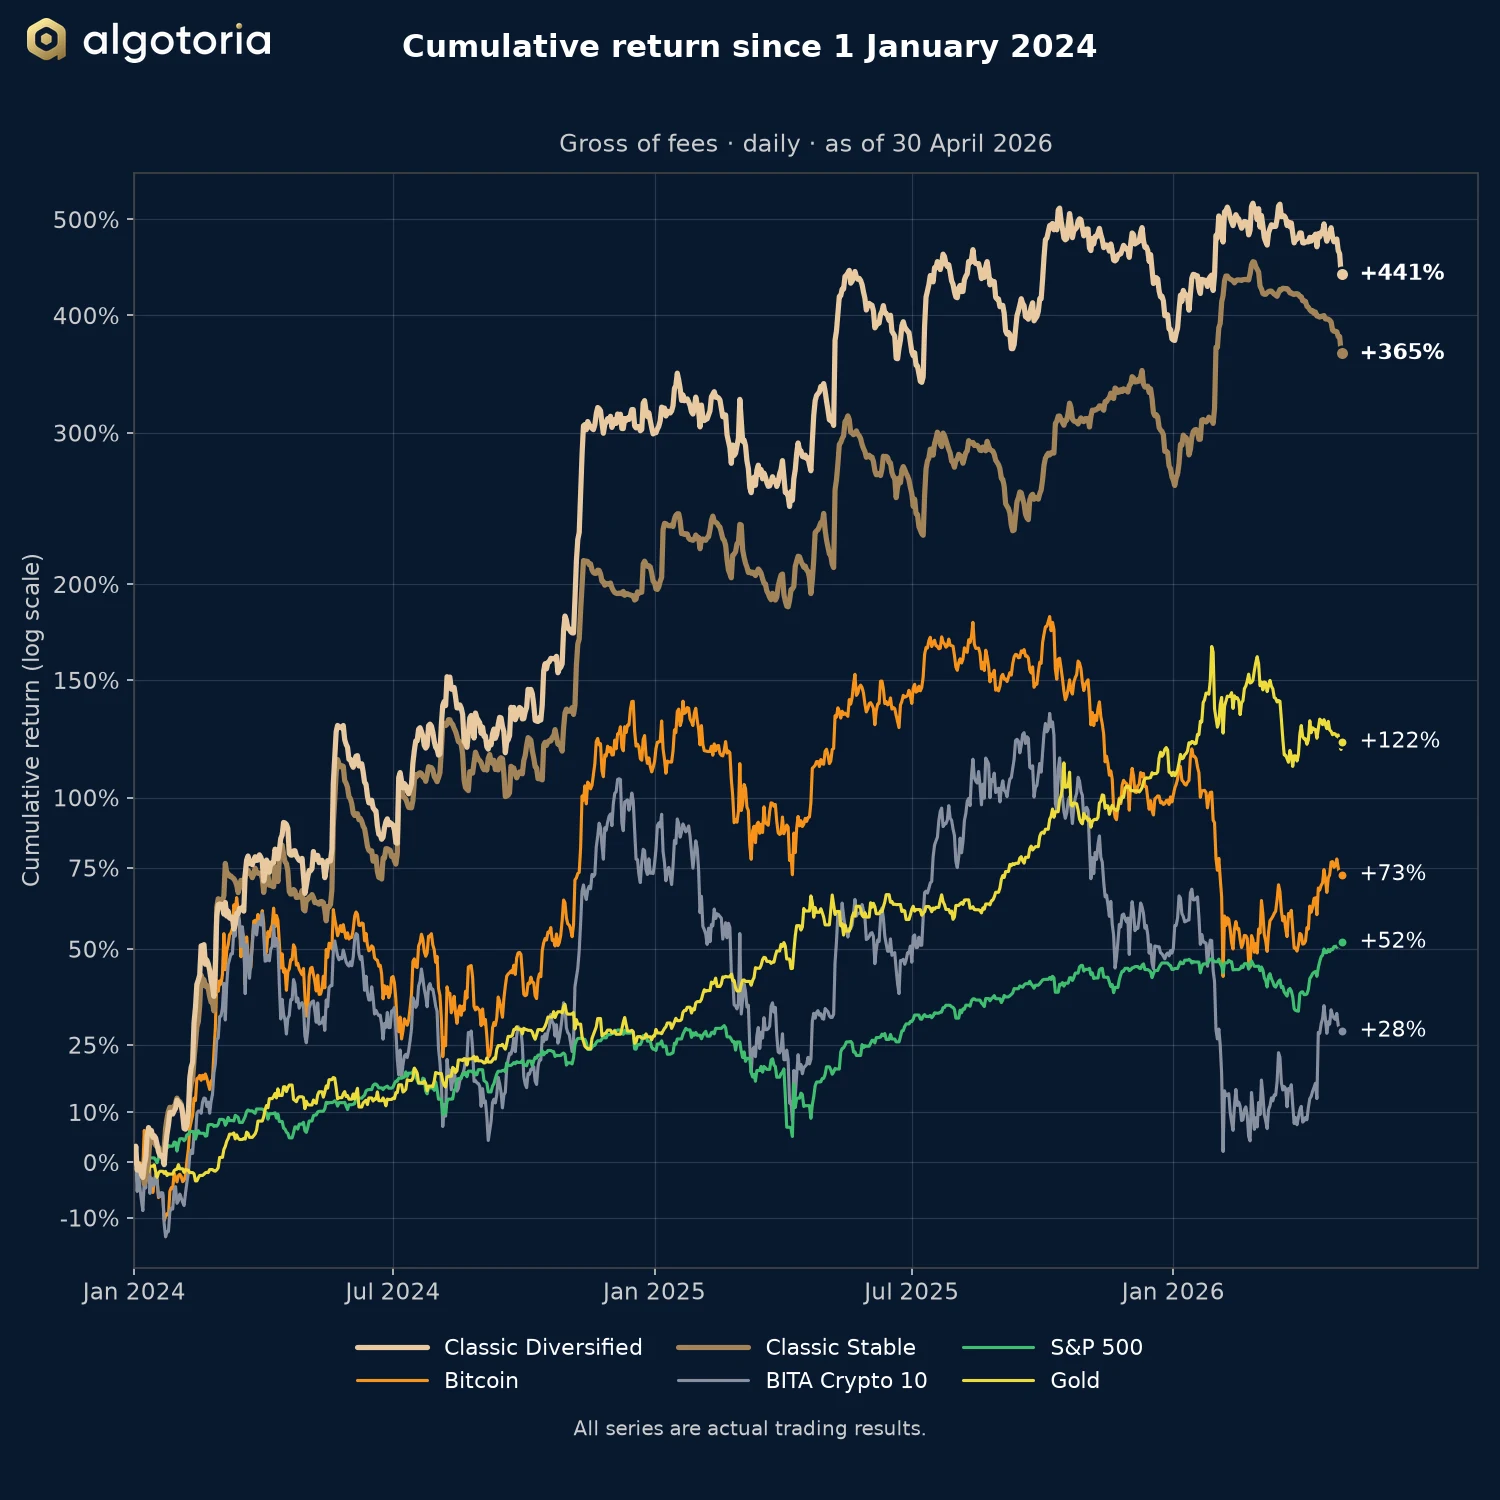
Line chart of cumulative return since 1 January 2024 for Classic Diversified and Classic Stable against Bitcoin, BITA Crypto 10, the S&P 500 and gold, as of 30 April 2026.
Cumulative return since 1 January 2024, gross of fees, as of 30 April 2026. Logarithmic scale.

April was a negative month for both Classic strategies. Classic Diversified returned −7.52% and Classic Stable −10.26%. Volatility in the crypto market stayed low for another month.

Performance

April 2026 and year to date
AprilYear to date
GrossNet 25%GrossNet 25%
Classic Diversified −7.52%−10.25%+13.09%+9.75%
Classic Stable −10.26%−16.78%+26.42%+16.67%
Longer periods
12 monthsSince 1 January 2024
GrossNet 25%Gross
Classic Diversified +23.14%+12.45%+441%
Classic Stable +35.51%+20.21%+365%
Returns to 30 April 2026.

Portfolio manager’s comment

A low-volatility month

The crypto market continued to trade at low volatility in April, and most assets remained in consolidation. Bitcoin returned +11.82% and the BITA Crypto 10 index +16.19%, but the moves came at low volatility. This limited what the trend-following algorithms could capture.

Classic Diversified lost less than Classic Stable. Part of its collateral is held in bitcoin, so the rise in the Bitcoin price reduced the strategy’s loss for the month. Classic Stable holds its collateral in stablecoins and does not receive this offset.

The drawdown phase

The sideways market has now lasted about three months, and the current drawdown phase about two. Range-bound markets are the hardest environment for trend-following strategies. Movements fail to extend, and the algorithms close positions at a loss before a sustained trend develops.

This pattern is a known part of the return profile of trend-following strategies. They give back part of their gains in a sideways market and recover when a directional move appears.

What the investment team monitors

The investment team continues to monitor volatility regimes, adapt the strategies and work on reducing drawdowns. Position sizing already responds to volatility automatically: leverage and position size fall when volatility rises and increase moderately when it falls.

Because Classic Diversified holds bitcoin as part of its collateral, its result also depends on the Bitcoin price, in either direction. Classic Stable does not carry this exposure.

Get Started

Typical onboarding takes one business day, plus the international bank transfer if you fund from fiat.

Start a conversation

Tell us a little about yourself and a co-founder will reply within one business day.

By submitting, you agree we may contact you at the details above. We do not share your data with third parties. For qualified investors only. We keep enquiry details for 12 months if they do not lead to a relationship. See our Privacy Notice at algotoria.com/privacy.

How is performance measured? Why does my exchange dashboard show a different number?

Daily time-weighted returns (TWR) with compounding, computed from the unrealised margin balance of each strategy's reference portfolio, denominated in USDT and rebased to 0.00% on 1 January 2024 for the public chart. TWR is the industry-standard methodology that eliminates the distortive effect of capital movements (deposits and withdrawals) on the percentage return. Exchange dashboards (OKX, Binance, Bybit) use simplified estimation methods that do not properly handle transfers, so their headline percentage will differ. The absolute dollar-denominated P&L on the exchange dashboard remains correct; only the percentage is affected.

What is the fee structure, and how does the high-water mark work?

Zero management fee, zero entry fee. A quarterly performance fee of 25–30% (tiered by allocation size) on Net Trading Profits above a rolling high-water mark. Formula: P = E − MAX(B, HW) − I, where E is the ending balance, B is the starting balance, HW is the rolling high-water mark, and I is net inflows/outflows. If the account falls below the HWM, no fees are levied until the deficit is fully recovered through trading gains. Clawbacks are explicitly not applied. Classic Diversified and Classic Stable both use the NAV-based variant (AMA §1.1.18(a)); the Isolated USDT variant (§1.1.18(b)) applies only to Custom-Collateral accounts. Fee tiering is documented in Exhibit 1 of the Asset Management Agreement.

How can I independently verify the live track record?

Via TradeLink Passport, which streams each strategy's reference portfolio through a read-only exchange API. Links to the Classic Diversified and Classic Stable portfolios are on the Classic Diversified and Classic Stable pages. On request, Algotoria will additionally provision read-only API keys to your designated auditor or verification platform, giving direct access to the full trade history and daily return series on the underlying exchange accounts — so you can reconstruct and verify every published metric without relying on firm-generated reports.

What drawdowns should I realistically expect?

Typical annual drawdowns of 20–25% on Algotoria Classic Stable, 15–30% on Algotoria Classic Diversified. Historical back-tests reached 30%. Drawdowns beyond these ranges trigger a formal Investment Committee review.

All drawdown figures quoted on this site — and the agreed drawdown budget selected during onboarding — are measured on the gross trading-account return curve, before deduction of Algotoria's quarterly performance fee. Net-of-fee drawdowns experienced by the investor are larger by construction. Worked example: for Algotoria Classic Stable over 2024-01-01 → 2026-09-30, the adjusted maximum drawdown is −24.7% gross, −30.2% net of a 25% fee, and −31.3% net of a 30% fee.

See the full due-diligence FAQ for 50+ additional questions.
Algotoria Limited is a BVI-regulated Approved Investment Manager under the Securities and Investment Business Act, 2010. The content on this page is informational and does not constitute an offer to sell securities or investment advice. Services are available to qualified investors only. Past performance is not indicative of future results.