Performance reports

Monthly report: October 2026

2 November 2026 · By Evgenii Voronchikhin

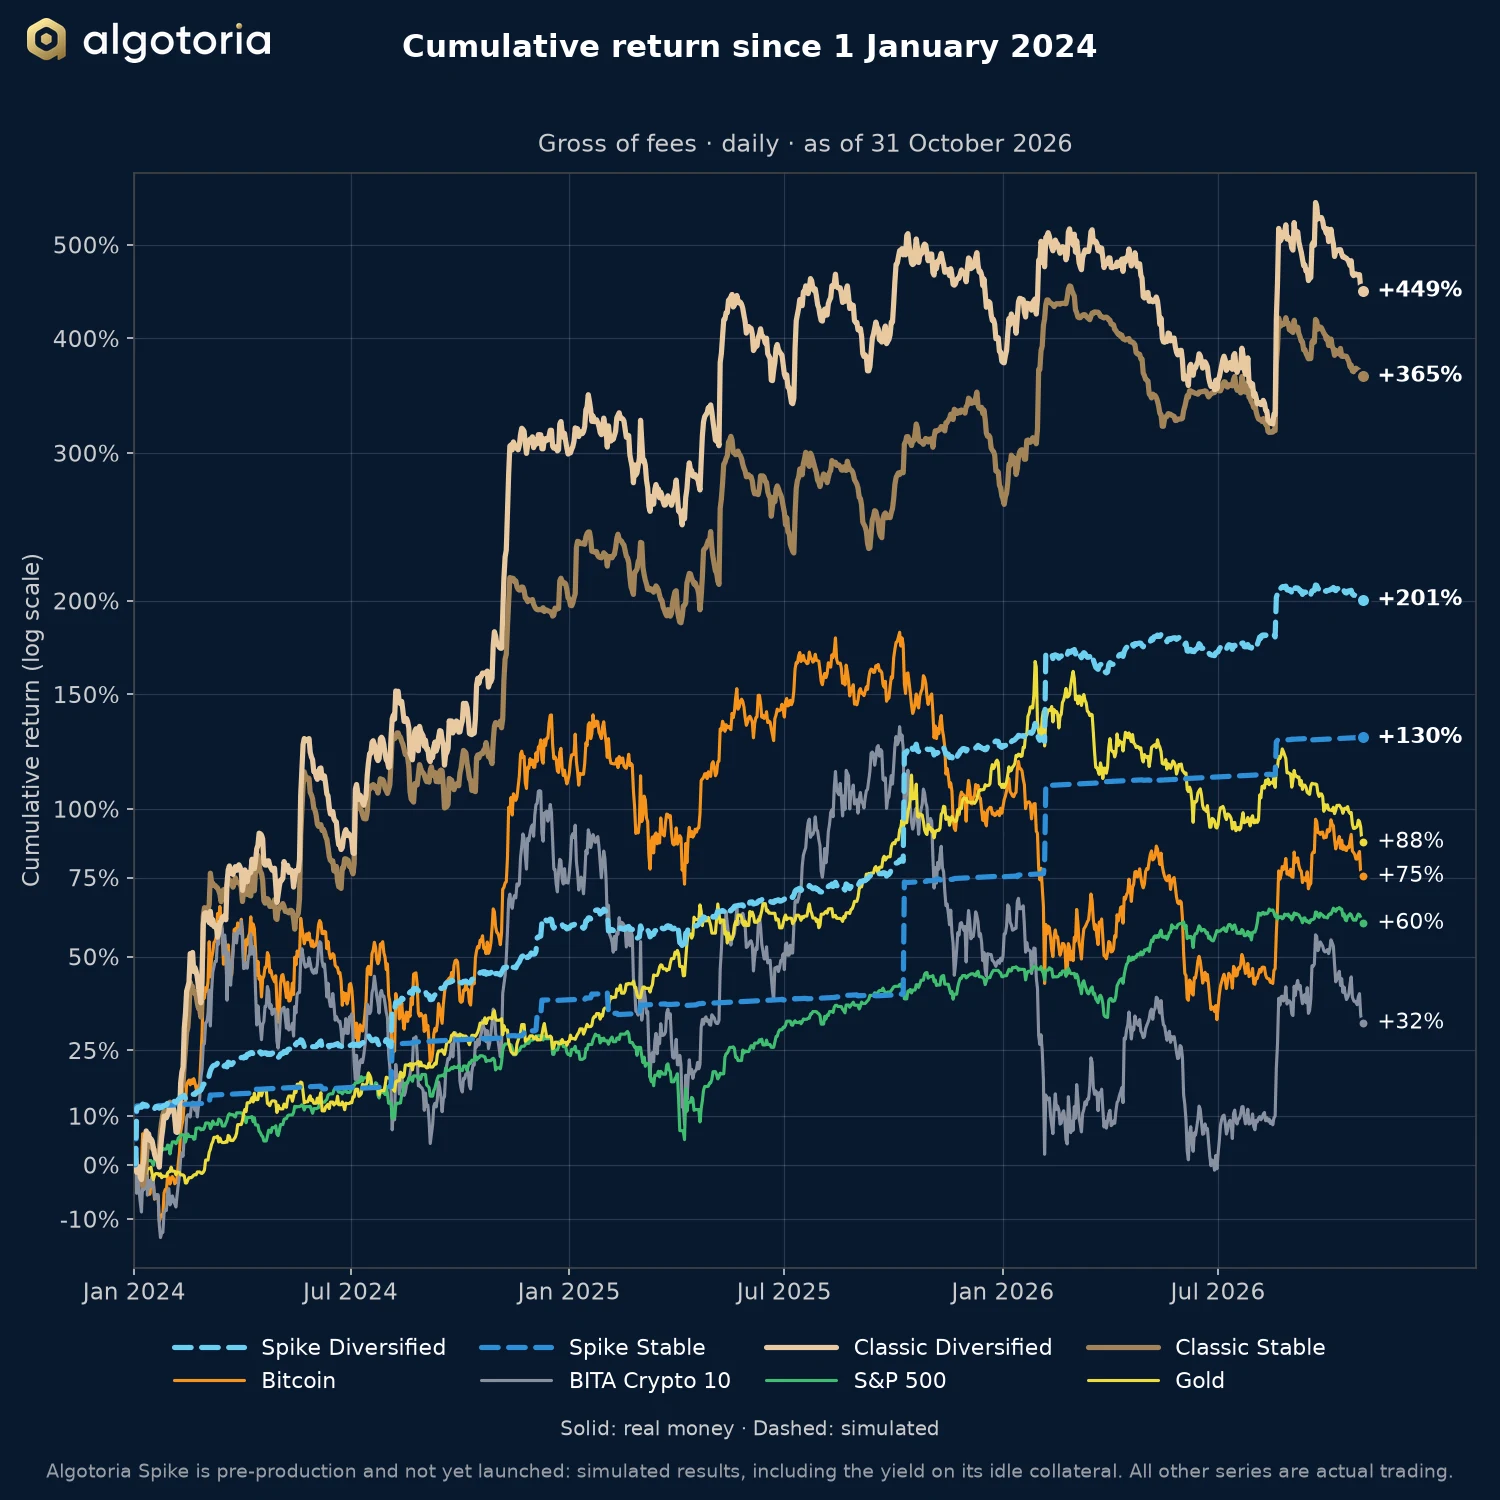
Line chart of cumulative return since 1 January 2024 for Spike Diversified, Spike Stable, Classic Diversified and Classic Stable against Bitcoin, BITA Crypto 10, the S&P 500 and gold, as of 31 October 2026.
Cumulative return since 1 January 2024, gross of fees, as of 31 October 2026. Logarithmic scale.

Both Classic strategies lost in October 2026: Classic Diversified returned −10.64% and Classic Stable −6.90%. The market fell as well, with Bitcoin at −7.28% and BITA Crypto 10 at −13.04%.

Performance

October 2026 and year to date
OctoberYear to date
GrossNet 25%GrossNet 25%
Spike Diversified (simulated) −1.58%−4.33%+33.37%+17.60%
Spike Stable (simulated) +0.36%−1.42%+31.20%+16.82%
Classic Diversified −10.64%−11.68%+14.68%+9.99%
Classic Stable −6.90%−6.90%+26.31%+16.56%
Longer periods
12 monthsSince 1 January 2024
GrossNet 25%Gross
Spike Diversified (simulated) +33.89%+18.06%+201%
Spike Stable (simulated) +32.22%+17.73%+130%
Classic Diversified −6.68%−10.50%+449%
Classic Stable +13.07%+4.35%+365%
Returns to 31 October 2026. Spike Diversified and Spike Stable are simulated.

Portfolio manager’s comment

October was a difficult month for our strategies. The market has changed: inside the trend structure there are now noticeably more sideways stretches. Directional movement is still there, but it comes in bursts, with long pauses and returns to the range.

For trend-following algorithms this is one of the hardest environments. A position opens on a breakout, and the price then comes back. The result is many false signals and stop-losses with no follow-through.

Classic Diversified fell further than Classic Stable because its collateral holds bitcoin, and bitcoin fell with the market.

What we are doing

We are re-optimising the parameters of all our strategies to adapt them to the current, difficult market. The aim is not to fit the last few weeks but to tune the algorithms to the changed structure of price movement.

What comes next

Results during a drawdown are never pleasant. The nature of the strategies has not changed, however: in a sideways market they lose gradually, and they have recovered quickly when the market broke out of a range with a strong move.

August is a recent example. After a consolidation of several months the market gave a strong impulse, and in that one month Classic Diversified returned +35.40% and Classic Stable +16.68%. The algorithms are built to capture the same kind of move when the market leaves its current range.

A horizon of three years or more

A single month or quarter does not show how effective a strategy is. It has to be judged over a long distance, and over that distance the returns remain strong. In the 24 months to 31 October 2026 Classic Stable returned +96.36% and Classic Diversified +95.80%, against +10.28% for Bitcoin and +2.16% for BITA Crypto 10.

Since inception the compound annual return is +113.7% for Classic Diversified, from 1 October 2023, and +72.1% for Classic Stable, from 1 January 2024. All these figures are gross of performance fees.

Spike

Spike, our strategy based on neural networks, stays out of the market most of the time, and it went through October noticeably more smoothly. The simulated Spike Diversified returned −1.58% and Spike Stable +0.36%. These are simulations in forward testing, not returns on client funds. The outcome of the test will decide whether Spike is added to client portfolios.

Get Started

Typical onboarding takes one business day, plus the international bank transfer if you fund from fiat.

Start a conversation

Tell us a little about yourself and a co-founder will reply within one business day.

By submitting, you agree we may contact you at the details above. We do not share your data with third parties. For qualified investors only. We keep enquiry details for 12 months if they do not lead to a relationship. See our Privacy Notice at algotoria.com/privacy.

How is performance measured? Why does my exchange dashboard show a different number?

Daily time-weighted returns (TWR) with compounding, computed from the unrealised margin balance of each strategy's reference portfolio, denominated in USDT and rebased to 0.00% on 1 January 2024 for the public chart. TWR is the industry-standard methodology that eliminates the distortive effect of capital movements (deposits and withdrawals) on the percentage return. Exchange dashboards (OKX, Binance, Bybit) use simplified estimation methods that do not properly handle transfers, so their headline percentage will differ. The absolute dollar-denominated P&L on the exchange dashboard remains correct; only the percentage is affected.

What is the fee structure, and how does the high-water mark work?

Zero management fee, zero entry fee. A quarterly performance fee of 25–30% (tiered by allocation size) on Net Trading Profits above a rolling high-water mark. Formula: P = E − MAX(B, HW) − I, where E is the ending balance, B is the starting balance, HW is the rolling high-water mark, and I is net inflows/outflows. If the account falls below the HWM, no fees are levied until the deficit is fully recovered through trading gains. Clawbacks are explicitly not applied. Classic Diversified and Classic Stable both use the NAV-based variant (AMA §1.1.18(a)); the Isolated USDT variant (§1.1.18(b)) applies only to Custom-Collateral accounts. Fee tiering is documented in Exhibit 1 of the Asset Management Agreement.

How can I independently verify the live track record?

Via TradeLink Passport, which streams each strategy's reference portfolio through a read-only exchange API. Links to the Classic Diversified and Classic Stable portfolios are on the Classic Diversified and Classic Stable pages. On request, Algotoria will additionally provision read-only API keys to your designated auditor or verification platform, giving direct access to the full trade history and daily return series on the underlying exchange accounts — so you can reconstruct and verify every published metric without relying on firm-generated reports.

What drawdowns should I realistically expect?

Typical annual drawdowns of 20–25% on Algotoria Classic Stable, 15–30% on Algotoria Classic Diversified. Historical back-tests reached 30%. Drawdowns beyond these ranges trigger a formal Investment Committee review.

All drawdown figures quoted on this site — and the agreed drawdown budget selected during onboarding — are measured on the gross trading-account return curve, before deduction of Algotoria's quarterly performance fee. Net-of-fee drawdowns experienced by the investor are larger by construction. Worked example: for Algotoria Classic Stable over 2024-01-01 → 2026-10-31, the adjusted maximum drawdown is −24.7% gross, −30.2% net of a 25% fee, and −31.3% net of a 30% fee.

Why are the Algotoria Spike results simulated, and what does that mean?

Neither Algotoria Spike strategy has managed client money yet. Their records are replays of the Algotoria Spike signal, generated walk-forward, through the production trading engine on exchange candles, so they show how the design would have behaved, not what an investor earned.

A simulation is not a track record: future results will differ, often materially, and all capital committed can be lost. The collateral rule of Algotoria Spike Diversified was chosen on data within the simulation window, so its figures are a hypothesis. Only Algotoria Classic has a real-money track record. Read the Risk Disclosure Notice before allocating.

Simulated execution for a constant $10 M book on OKX: every order sized and capped as if the book were $10 M, filled on the historical 1-second order book under the production execution loop, taker fees included; returns compounded.

See the full due-diligence FAQ for 50+ additional questions.
Algotoria Limited is a BVI-regulated Approved Investment Manager under the Securities and Investment Business Act, 2010. The content on this page is informational and does not constitute an offer to sell securities or investment advice. Services are available to qualified investors only. Past performance is not indicative of future results.